Stock market indicators are the support systems for any decision of traders. They are used to form different patterns based on historical data so that the entry and exit points can be decided in any trade. By the exact analysis of any indicator it is possible to attain maximum profit. From Dow jones live to Nifty every stock in any market or any index can be analysed using these stock market economic indicators.
Types of Stock Market Indicators
Among all the types of stock market Indicators the most popular ones are as follow :
- MOVING AVERAGE
- EXPONENTIAL MOVING AVERAGE
- STOCHASTIC OSCILLATOR
- MOVING AVERAGE CONVERGENCE DIVERGENCE
- BOLLINGER BANDS
- RELATIVE STRENGTH INDEX
- FIBONACCI RETRACEMENT
- ICHIMOKU CLOUD
- STANDARD DEVIATION
- AVERAGE DIRECTIONAL INDEX
In the previous blog PART 1 we discussed the first five Indicators. In this blog we are going to discuss the last 5 technical indicators.
Relative Strength Index
RSI is similar to a stochastic oscillator in many ways. It also provides indication for overbought and oversold zones. It is more useful in trending markets. RSI provides readings based on the daily market movements of the stock market. It has a range from 0 to 100. Any reading below 30 is addressed as an oversold zone and any reading above 70 is referred as an overbought zone. It is used more than Stochastic indicator and is more reliable than it.
RSI is a price change based indicator (momentum indicator). It was developed in 1978 by J. Wells Wilder. It triggers the entry and exit points based on the bearish and bullish signals.
RSI can stay in an overbought zone for more time if the stock is having an uptrend movement. Similarly it can stay in an oversold zone for more time it the stock is having a downtrend movement.
Here bullish signals are provided when the RSI stays in oversold zone for more time and it doesn’t go below the lows of the previous day or previous time period. This can be a strong signal for bullish momentum. Similarly when RSI stays for more time in an overbought zone but is unable to stay above or go near the higher high of the stock and is constantly having some degradation in price it can signal a bearish momentum for that stock.

Fibonacci Retracement
It is a market movement indicator. Fibonacci Retracement confirms the market trend for traders in times of possible retracement opportunities. It tells the degree of market movement against the ongoing trend. Whenever there is a big dip the traders use this indicator to get information about the time for reversal and hence they earn handsomely using this trend indicator. Retracement itself means an indication for market U-turn or market trend change.
This indicator takes notice of support and resistance levels of the market and decides the trend of the market. This helps a lot in preparing strategies while performing algorithmic trading.
![Fibonacci Retracements [ChartSchool]](https://school.stockcharts.com/lib/exe/fetch.php?media=chart_analysis:fibonacci_retracemen:fibo-2-mmmretra.png)
Ichimoku Cloud
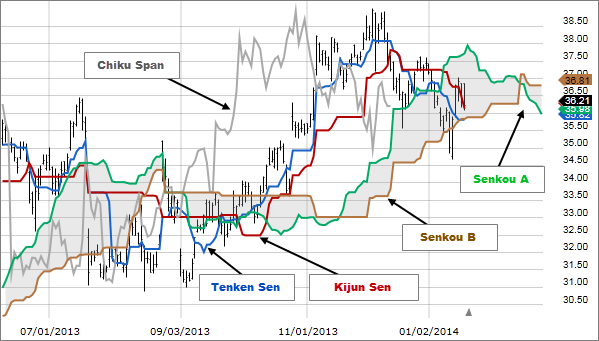
Ichimoku Cloud is a very complex indicator. It identifies the support and resistance points along with the price movements of the stocks. It also helps in forceasting the future price movements.
Ichimoku cloud is a Japanese indicator and its full name is Ichimoku Kinko Hyo which also means one look and one equilibrium. It has five lines in the chart analysis. They are :
- TENKAN- SEN :- It is the conversion line with a measurement of nine periods of highs plus lows divide by 2. Hence it is the centre point of the 9 day high-low.
- KIJUN – SEN :- It is the base line with 26 periods high plus low divide by 2. Hence it is the centre point of 26 day high and low.
- SENKOU – SPAN A :- It is conversion and base line. It marks the centre points between the above two lines and forms the limits and boundaries of the upper cloud segment.
- SENKOU – SPAN B :- This contains the high of 52 weeks plus lows of 52 weeks divide by 2. Hence it forms a segment of point in between the movement of 52 weeks and also forms the lower cloud boundaries.
- CHIKOU SPAN:- It is the lagging span showing the closing levels that are from 26 days history (before the given day).
It is a very useful indicator because it identifies not only the current movements but also gives future projections and support & resistance points making it a very unique indicator. It shall be put together with various indicators to know the exact movement of market.

Standard Deviation
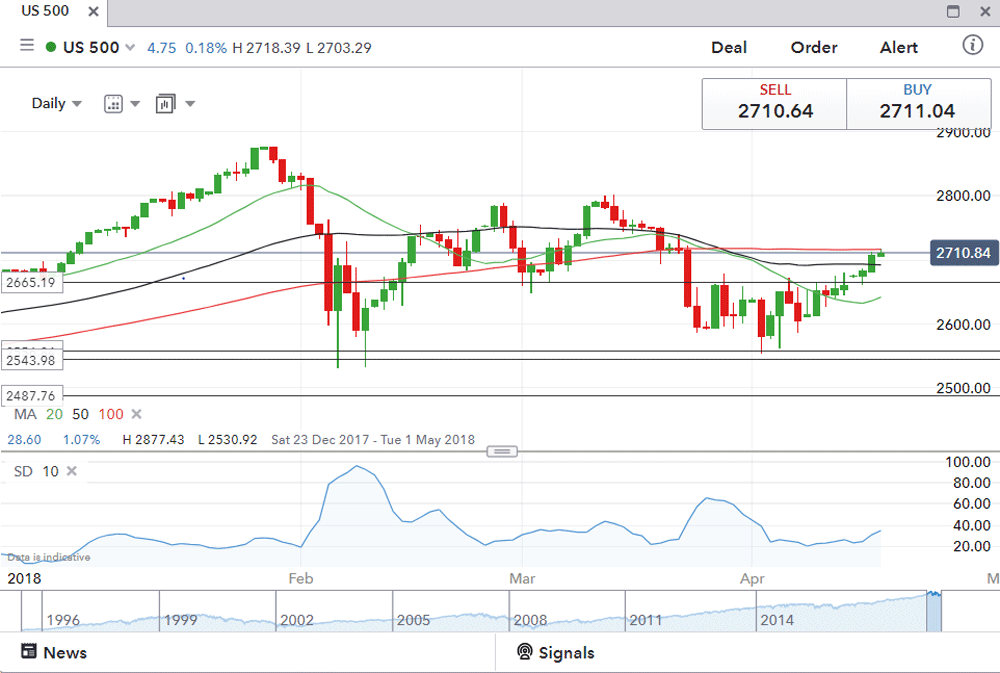
It is not an indicator for price movements. Rather it is useful in measuring the volatility in the price movements. It does not predict the direction of the price but helps in determining how much change is possible in the given scenario by analysing the current and historical price levels.
When the level of standard deviation chart increases or narrows (decreases) it is an indication of volatility and hence the quiet time has gone and some big movement is about to occur soon. Period setting is possible as per the risk appetite of the trader. If the period is less than high risk is possible with more trading entry points and vice-versa.

Average Directional Index
It is very useful in knowing the strength of an uptrend or downtrend. It has a reading from zero to hundred. An indication above 25 is a signal of stable and strong trend whereas anything below 25 is known as drift. It is majorly helpful in knowing the continuation of an upward or downward movement. It is having a setting for analysing the price trend on the basis of past 14 days of stock movement normally. However the setting for period is changeable on the basis of trader’s preference.
![Average Directional Index (ADX) [ChartSchool]](https://school.stockcharts.com/lib/exe/fetch.php?media=technical_indicators:average_directional_index_adx:adx-3-jwntrend.png)


